Figures
Capture each figure in a fig element.
//fig[@id]
Give each fig element an id attribute.
Capture the fig element according to the placement indicator in the manuscript, or (if there is no such indicator) after the paragraph in which it is cited.
A fig element may only be a child of a p element if it is within a list or a footnote.
Capture the figure number in a label element, in the format Figure
1
or Fig. 1
.
Capture the figure caption in a caption element.
Capture information about the source of an image in a attrib element.
Figure in a journal article
<fig id="fsx218-f1">
  <label>Fig. 1</label>
  <caption><p>Odds ratios of death by end of follow up were calculated
by fixed effects model.</p></caption>
  <graphic xlink:href="acw09401.png" mimetype="image">
    <alt-text>Deaths in hospitals or with alternative services</alt-text>
  </graphic>
</fig>
Print and online variants of an image in a book
For example, there may be a black-and-white version for print and a colour version for digital publication.
There may also be print and online versions of the caption.
The alt-text element is not required in a print-specific version.
<fig id="workid-UKRAI10JL5MB-book-part-1-fig-1">
  <label>Fig. 1.1</label>
  <caption specific-use="print"><p>AP radiograph of the ankle joint
    demonstrating a multisegmental fracture.</p></caption>
  <caption specific-use="online"><p>Colour radiograph of the ankle joint
    demonstrating a multisegmental fracture, highlighted in green.</p></caption>
  <graphic specific-use="print" mimetype="image"
    xlink:href="workid-UKRAI10JL5MB-book-part-1-graphic-1.jpg"/>
  <graphic specific-use="online" mimetype="image"
    xlink:href="workid-UKRAI10JL5MB-book-part-1-graphic-1-colour.jpg">
    <alt-text>Radiograph of the ankle joint demonstrating a multisegmental fracture</alt-text>
  </graphic>
</fig>
Figure with source attribution
<fig id="workid-UKRAI10JL5MB-book-part-2-fig-10">
  <label>Figure 2.7</label>
  <caption><p>PC activities in eyeblink conditioning:
    experimental recording and LSM simulation.</p></caption>
  <graphic id="workid-UKRAI10JL5MB-book-part-2-graphic-19"
    xlink:href="workid-UKRAI10JL5MB-graphic-011.gif" mimetype="image">
    <alt-text>PC activities in eyeblink conditioning</alt-text>
  </graphic>
  <attrib>B, C: Learning stimulus intervals—adaptive timing of conditioned
    Purkinje cell responses, Cerebellum, 10, 2011, pp. 523–535
    Jirenhed and Hesslow © Springer Science+Business Media Dordrecht.
    With permission of Springer.</attrib>
</fig>
Figure in a list
In this case, the fig element is allowed to appear as a child of a p element.
<list list-type="number">
  <list-item>
    <label>1</label>
    <p>
      <fig id="workid-UKRAI10JL5MB-book-part-13-fig-1">
        <label>Figure AK.1</label>
        <graphic xlink:href="workid-UKRAI10JL5MB-068.png" mimetype="image">
          <alt-text>Alt text goes here</alt-text>
        </graphic>
      </fig>
    </p>
  </list-item>
  <list-item>
    <label>2</label>
    <p>Answers will vary, ...</p>
  </list-item>
</list>
Figure consisting of multiple images
If a figure consists of a group of multiple images, each with its own label and/or caption, and the figure itself has a label/caption applying to the group as a whole, use a fig-group element (with id attribute) to contain all the images in the group.
<fig-group id="isbn-9780190924232-book-part-2-fig-group-1">
<label>Figure 1.1</label>
<caption>
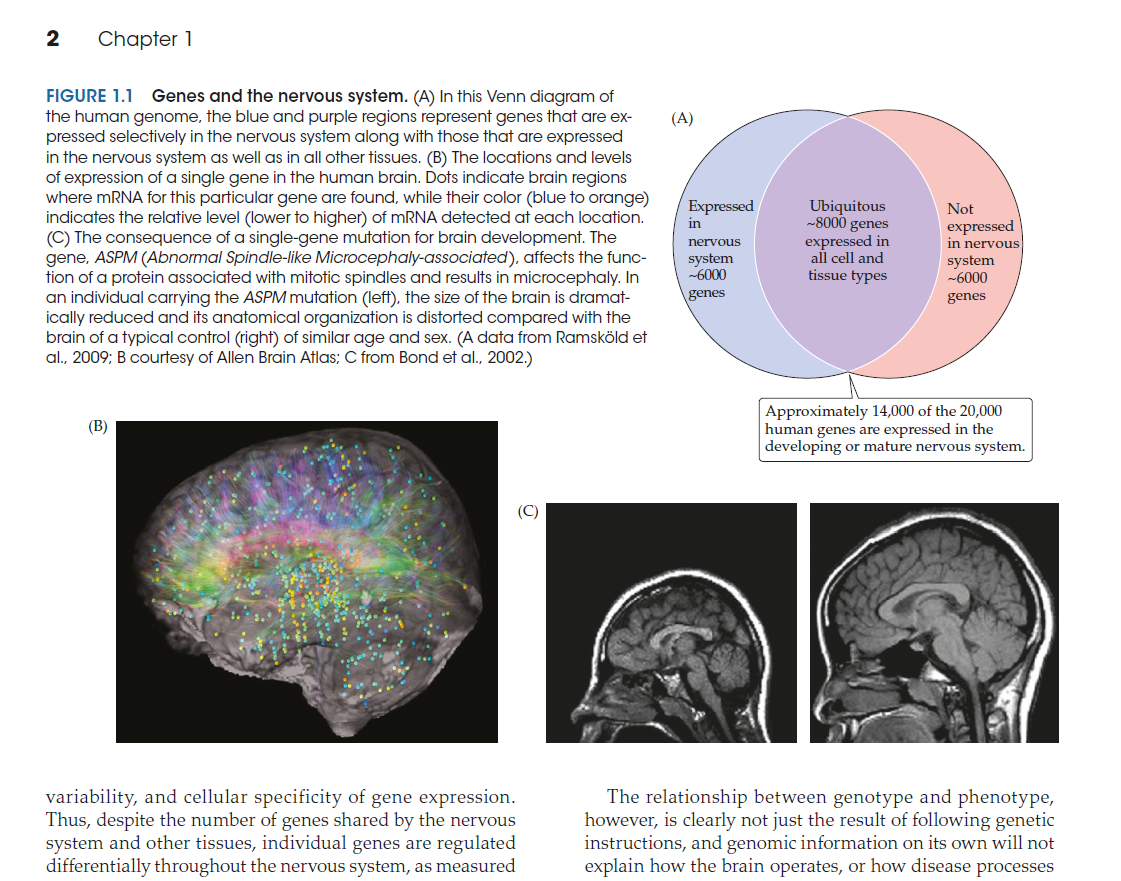
<title>Genes and the nervous system.</title>
<p>(A) In this Venn diagram of the human genome, the blue and purple regions
represent genes that are expressed selectively in the nervous system along
with those that are expressed in the nervous system as well as in all other
tissues. (B) The locations and levels of expression of a single gene in the
human brain. Dots indicate brain regions where mRNA for this particular gene
are found, while their color (blue to orange) indicates the relative level
(lower to higher) of mRNA detected at each location. (C) The consequence of
a single-gene mutation for brain development. The gene, ASPM (Abnormal
Spindle-like Microcephaly-associated), affects the function of a protein
associated with mitotic spindles and results in microcephaly. In an individual
carrying the ASPM mutation (left), the size of the brain is dramatically
reduced and its anatomical organization is distorted compared with the brain
of a typical control (right) of similar age and sex.</p>
</caption>
<fig id="isbn-9780190924232-book-part-2-fig-1">
<label>(A)</label>
<graphic xlink:href="isbn-9780190924232-book-part-2-graphic-1.png" mimetype="image"/>
</fig>
<fig id="isbn-9780190924232-book-part-2-fig-group-fig-2">
<label>(B)</label>
<graphic xlink:href="isbn-9780190924232-book-part-2-graphic-2.png" mimetype="image"/>
</fig>
<fig id="isbn-9780190924232-book-part-2-fig-group-fig-3">
<label>(C)</label>
<graphic xlink:href="isbn-9780190924232-book-part-2-graphic-3.png" mimetype="image"/>
</fig>
<attrib>A data from Ramsköld et al., 2009; B courtesy of Allen Brain Atlas;
C from Bond et al., 2002.</attrib>
</fig-group>